
Ecosystem for DOOH Display Network
Digital-Out-Of-Home (DOOH) advertising refers to multimedia advertising in public spaces that is presented on screens or interactive devices.
How could we design an ecosystem of apps that maximizes the usefulness and profitability of a network of DOOH (digital-out-of-home) screens?
To protect project confidentiality, the methodologies used have been recreated without including data.
Context
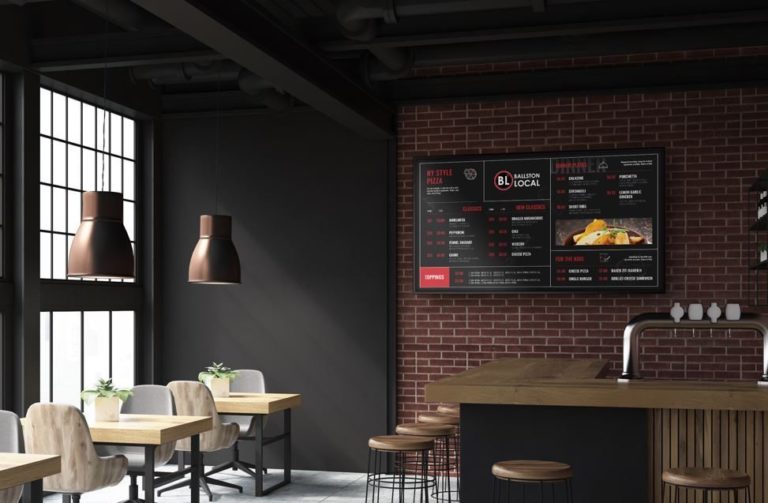
- The screens are mainly installed in bars, restaurants and cafes.
- In 2014 there were many installations of giant screens, but no network of small screens well distributed.
- The industry standard was to copy videos to a memory card and put it on the screen.
- The screens include a special Wi-Fi router that detects and measures nearby people.
- Why would the owner of a bar install a screen with advertising content?
- What advantages or disadvantages did this medium have over another, and how could we design to improve?
- What factors determine the value of advertising, and how can they be influenced?
- How can this ecosystem be designed to facilitate the scalability of the business model?
Understanding the challenge
Advertising networks are platforms that serve as intermediaries between two parties, advertisers and the owners of the space with a potential audience. In this case, the owners of the premises that install screens are one of the parties, and the advertisers are the other. The value proposition must be attractive to both if we want them to remain active in the ecosystem, and the business model must intermediate between them without leaving any at a disadvantage.
To define teh relationship between all the parties, we carried out three blocks of interviews:
Sales force
With experience in other advertising branches and with direct contact with locals and advertisers.
Advertisers
Mainly large agencies, but also some local entities (real estate, municipalities...).
Local owners
They conveyed their expectations and concerns about participating in this ecosystem.
The main learnings and findings of this research were the following:
- The commercials feared that such a new concept would be difficult to explain and would not generate enough confidence in the model.
- Advertisers expected the immediacy and granularity of digital media, with special interest in audience planning and segmentation.
- The owners of the premises perceived the screens as a source of problems for which they did not feel prepared. In addition, the value proposition was not concrete enough.
Design process
Defining the platform
Based on the learnings of user research, we carry out workshops with stakeholders to specify the value proposition that best fits with what was learned from the owners of premises and advertisers:

Structuring the ecosystem
In addition to the owners and advertisers, an ecosystem includes other relevant actors with their specific needs. To define the tools that make up the ecosystem we map the different users and their key tasks, from which we analyze each of these tasks to identify their workflow and what functionalities should be articulated in which tool. With this understanding we can make a prioritization following the Kano model to generate a roadmap that represents the weighted needs of all those affected.


With these elements we could already finish and test the information architecture, defining the main navigation of each tool in the ecosystem and the strategy of organizing the contents and functionalities. Additionally, we created a basic layout with a first catalog of components that could be adapted to each tool with its own visual theme.


Increasing and qualifying audiences
To increase the reach of the DOOH network and build trust in the owners of the premises, it was necessary to design a strategy with which to increase the traffic of people to the premises with screens in a demonstrable way. Part of the knowledge generated by audience analysis can be applied for this purpose. We held several workshops to identify two key concepts:
- What data the ecosystem already has to provide value to a user at the time of deciding which business to go to.
- What data could be collected to increase the intelligence of the ecosystem and feed back the value proposition.

If you want to know more details about this project, do not hesitate to get in touch.
ContactProposal
-
 The owners of the establishments with screen and WiFi service had an application from which to manage the digital presence of their business both in the DOOH ecosystem and on social networks, with a unique profile and publishing ads created through templates.
-
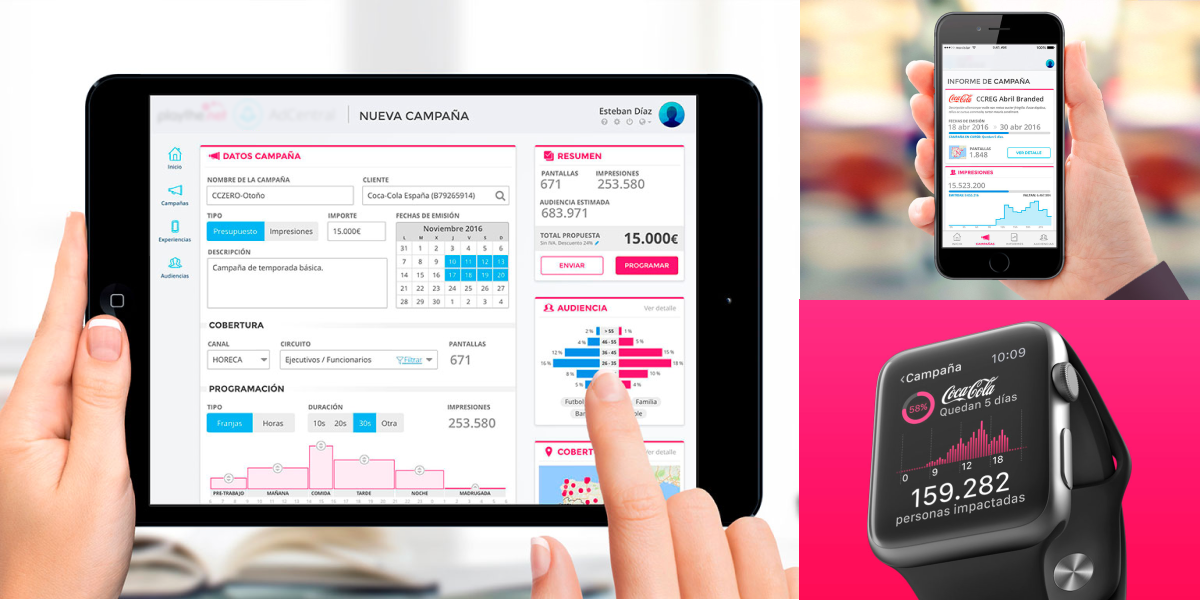 Salespersons and advertisers could simulate and configure campaigns, based on the profiling of the face-to-face and digital public of the establishments. Real-time data allows immediate follow-up and even adapt the campaign to optimize results..
-
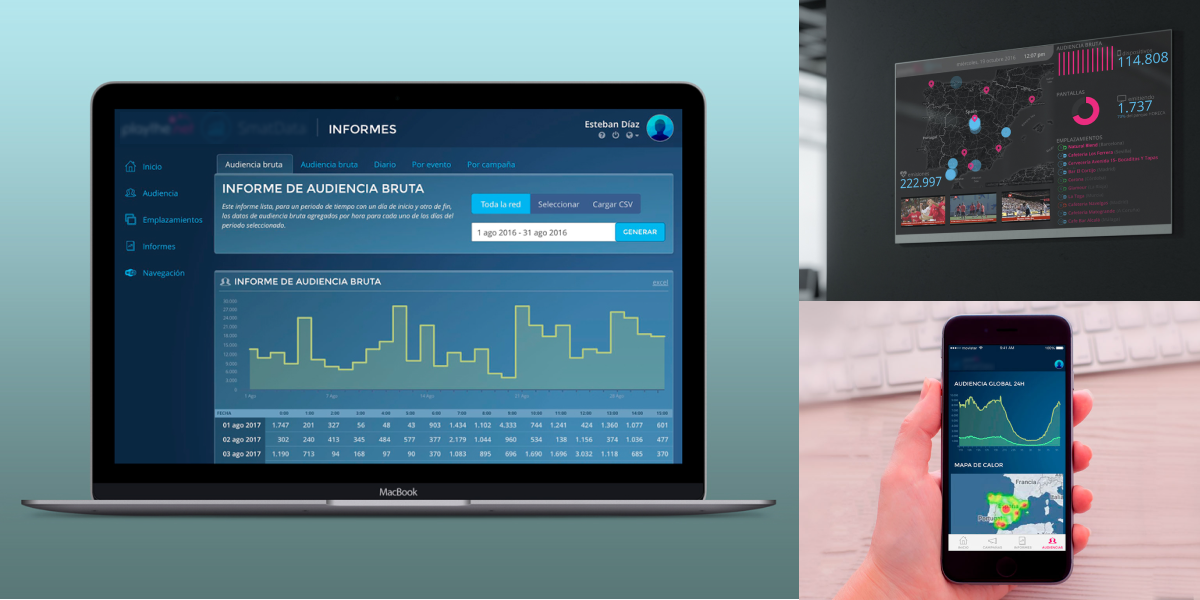 All data from the DOOH ecosystem can be exploited in an analytical tool for quantitative research. The system allowed the incorporation of new sources of public and private data to detect patterns, validate hypotheses and make strategic decisions.
-
 The authentic social network of people is the hospitality industry, and it used ecosystem data to make it easier for consumers to compare nearby premises for their offer of products, services and occupancy status. Its app roadmap included booking, payment and gamification functionalities.
Results
x6 SUPPORT REQUEST CALLSAfter implementing onboarding improvements and onsite help.
x3 SELF-MANAGED CONTENTBy redesigning the content editor, the assistant and the template catalog.
x10 AVERAGE ADVERTISING HIRING TIMEBoth for local advertisers and for large agencies.
50% FREQUENCY OF ADVERTISING HIRINGBy facilitating the renewal, reuse and extension of campaigns.
x2 AVERAGE impression PRICEFor the capabilities of segmentation and reporting of audiences.
x4 CONVERSION OF GROSS AUDIENCE INTO QUALIFIEDAfter the publication of an app and improvements in the conversion funnel.
70 QUALIFIED DATA BY USERSLocation, demographic, economic and consumption habits.
120 QUALIFIED DATA PER SCREENLocation, type of establishment, economic information, services, brands and activity history.

